Evaluating Drug Embeddings in Predicting Cancer Treatment Responses: A Comprehensive Analysis
Introduction
Historically, the process of drug discovery has been marked by both labor intensity and high costs, predominantly confined to physical laboratory environments. However, the emergence of computational techniques and deep learning has brought about a significant shift in this field. In this context, this project contributes by analyzing various drug embeddings such as SMILES, SELFIES, SMILES Tokens, and Morgan fingerprints. I aim to determine which of these embeddings most effectively enhances predictive accuracy in cancer treatments, thereby offering a potentially valuable tool in the ongoing quest to refine and improve the drug discovery process.
The full code to reproduce the results is available here.
This work was part of my term project for course ECSE556: Deep Learning for Biology Networks at McGill University.
Problem Definition
The challenge of Drug Response Prediction (DRP) is to anticipate the effects of a drug compound on specific cancer tissue. The process involves the equation r = f(d, c), where r is the drug response, d the drug compound, c the cancer tissue, and f the predictive model. The core of advancing DRP lies in the precise representation of each variable, aiming to closely reflect the biological intricacies involved.
Drug response r
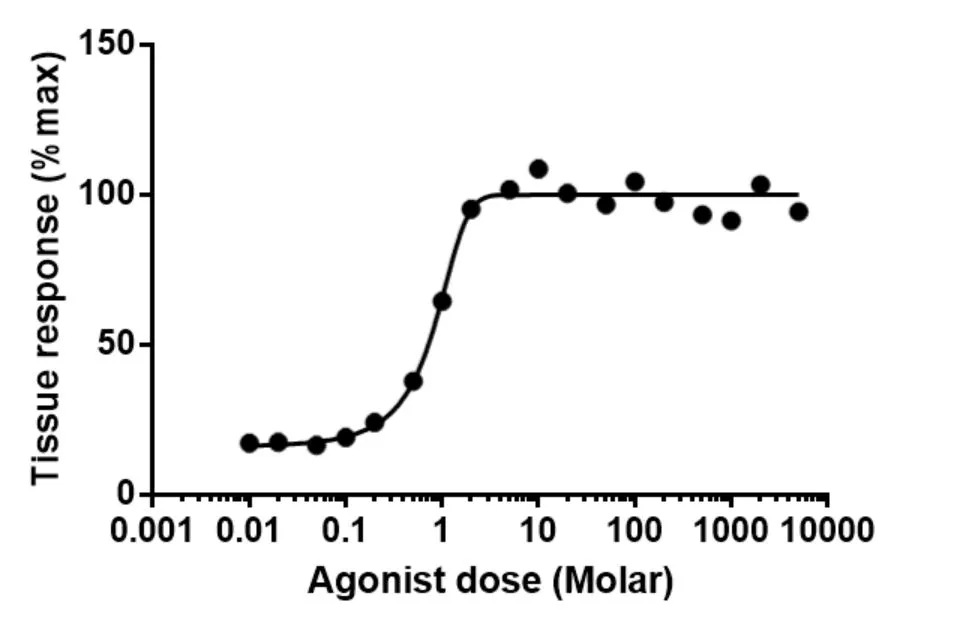
In the field of DRP, several representations for drug response r have been established, primarily revolving around metrics derived from drug-response curves, which graphically represent the relationship between drug concentration and the biological response it elicits. Among these, the IC50 value has emerged as the most prevalent metric in research literature. It represents the concentration of a drug needed to inhibit 50% of cell activity, with a lower value indicating a higher efficacy of the drug on the cell. While IC50 provides a significant measure of drug response, it has been argued that this single value may not comprehensively capture the entire spectrum of the drug response curve’s characteristics. Consequently, additional metrics such as the Area Under the drug response Curve (AUC) and the Area Above the drug-response Curve (AAC) have been introduced. These metrics calculate the areas under and above the drug response curve, respectively, and have demonstrated improved generalization capabilities in models trained for predicting drug response.
Cancer tissue c
In most research settings, biological tissues are represented through cell lines, where cells from the same tissue are tested in identical environments, known as wells. The results are averaged across multiple wells to enhance robustness. A crucial aspect of representing these cells involves protein coding gene expressions. Proteins play a pivotal role in cellular functions; hence, their presence is indicative of the cell’s state. The expression of a gene coding for a specific protein – evident through the presence of corresponding mRNAs – serves as a reliable proxy to model the cell’s state. This underpins the rationale for using protein coding gene expressions as effective representations of cells c in cancer research.
Predictive model f
Recent advances in the field of DRP have predominantly utilized Deep Learning techniques for the model f. Deep Learning models are particularly adept at handling large volumes of high-dimensional data, characteristic of omics data commonly employed in biology-related problems. This research also adopts Deep Learning models, aligning with contemporary state-of-the-art methodologies
Our study builds on existing efforts in DRP by examining how SMILES and SELFIES embeddings, respectively obtained through chemBERTa and SELFormer pre-trained models, can potentially improve the accuracy of predicting drug responses in cancer treatments. We specifically explore how these models, pre-trained on large datasets using techniques inspired by the RoBERTa framework, might offer more detailed molecular insights compared to traditional approaches. We hypothesize that such embeddings representations can capture complex molecular details beyond traditional methods, offering a more accurate prediction of a drug’s effectiveness against cancer.
Drug d
The choice of drug representation d is pivotal in DRP. Traditional methods in machine learning (ML) and deep learning (DL) often involve feature engineering from known compound characteristics. Among these, Morgan Fingerprints stand out due to their ability to capture the molecular structure and properties effectively. Morgan Fingerprints are a type of circular fingerprint used in cheminformatics for structure representation. They encode the presence of particular sub- structures in a molecule, making them highly informative for ML and DL applications.
Other modern representations, especially suited to DL, include graph and string-based methods. Graph embeddings consider molecules as graphs, deriving embeddings that reflect the molecular structure. String-based representations like SMILES and SELFIES encode atomic types and molecular geometry in a 1D string format. The latter offers robustness by ensuring all sequences represent valid molecules. Leveraging the language-like structure of SMILES and SELFIES, Transformer architectures have been employed. ChemBERTa and SELFormer, pre-trained using RoBERTa’s Mask Language Modeling scheme, represent large Transformer models trained on significant datasets of SMILES and SELFIES, respectively. These models have been proven to generate representative compound embeddings, beneficial in fine-tuning tasks.
The focus of this work is on evaluating the effectiveness of SMILES and SELFIES embeddings in DRP, particularly in cancer drug discovery, against other benchmark representations such as Morgan Fingerprints, and SMILES Tokens.
Methodology
To effectively measure the impact of different drug representations, our study involved training four distinct models. Two models were dedicated to exploring the effects of using SMILES and SELFIES embeddings, while the other two, employing SMILES tokens and Morgan fingerprints, served as baseline comparators. The goal was to assess the relative performance of each drug representation method in the context of DRP.
DRP Dataset
The dataset foundation for our DRP models stems from integrating the Depmap cell lines database with the CTRP v2 drug response database. This amalgamation yields an impressive 413,660 pairs of (drug response, drug, cancer cell line) across 481 compounds and 860 different cancer cell lines, creating a robust and diverse dataset representative of various cancer processes. The drugs in the dataset are initially presented in SMILES format, necessitating conversion to other formats as needed for our analyses.
Key to characterizing cancer cell lines in this study is the use of gene expressions from protein-coding genes. We applied a variance filter to these gene expressions, retaining only those with a variance greater or equal to one across all cell lines. The rationale behind this selection is to reduce noise in the data, focusing on gene expressions that significantly vary across diverse cancer environments, thus potentially relating more closely to biological cancer processes. This approach is a standard preprocessing step in bioinformatics. Additionally, the effects of drugs on each cell line are quantified using the Area Under the drug-response Curve (AUC), as previously described.
In preparing the dataset for model training, we employed a drug-blind split, allocating 20% of all samples to a test set comprising exclusively drugs not seen during the training phase. This strategy aligns with our goal of enhancing drug discovery for cancer treatments, ensuring that the model’s predictive capability is tested on novel compounds. Preprocessing included scaling each gene expression and AUC value between -1 and 1 using a MinMax strategy, with scalers fitted on the training set and subsequently applied to the test set to avoid data leakage.
Embeddings Generation
The generation of SMILES and SELFIES embeddings was accomplished using two pre-trained models: chemBERTa and SELFormer, respectively. Both models underwent self- supervised pre-training using the RoBERTa Mask Language Modeling scheme. This involved obscuring one of the to- kens in the SMILES (or SELFIES) sequence and prompting the model to predict the missing token. Such a pre-training approach has proven effective in enabling models to learn semantically rich latent representations of the sequences.
To enhance training efficiency, all embeddings were pre- computed and stored before the training phase. This preemptive step eliminated the need to generate embeddings during training, thereby accelerating the process.
Each SMILES (or SELFIES) embedding is composed of a fixed sequence of 256 tokens, with each token corresponding to an embedding vector of size 768. The total dimension of one SMILES (or SELFIES) embedding is thus (256, 768). This configuration was chosen for its potential to encapsulate maximal information. However, it’s possible to reduce the complexity of these embeddings, and consequently, the model’s capacity, by averaging over the first dimension to obtain a single embedding vector of size 768 for each SMILES (or SELFIES). This alternative could potentially speed up the training process.
It is important to note that the two models were pre-trained on different volumes of data. The chemBERTa model was pre-trained on 10 million SMILES from the Pubchem10M database while the SELFormer model was pre-trained on 2 million SELFIES from the ChEMBL database. This discrepancy in pre-training datasets could introduce variations in our study results. Firstly, a larger pre-training dataset might yield a more representative latent representation of chemical properties. Secondly, there is a risk of data leakage from the pre-training set to the test set if one embedding model encountered the test compounds during its pre-training phase, while the other did not. This aspect warrants further investigation in a subsequent study.
For the generation of SMILES tokens, we utilized chemBERTa’s Byte Pair Encoding (BPE) tokenizer. This process involved decomposing each compound’s SMILES string into a series of 256 tokens derived from chemBERTa’s specific vocabulary. Within our model architecture, an embedding layer was responsible for storing and learning the embeddings of each token. Consequently, the encoder transformer block in our architecture processed a SMILES representation with dimensions of (256, 768), aligning it with the dimensional framework of the other representations. This approach was adopted to discern whether the efficacy of SMILES embeddings was attributable to the embeddings themselves or primarily a result of the transformer architecture’s capabilities.
In the case of Morgan fingerprints, these were formulated as binary vectors of length 2048. Each bit in these vectors represented either the presence (1) or absence (0) of a specific chemical pattern in the compound, as indexed. These binary vectors were generated from the compounds’ SMILES representations using the rdkit Python library. The parameters for this process were mostly default settings, with two notable exceptions: the inclusion of chirality information and setting the fingerprint radius to three. This method ensured that each fingerprint vector provided a comprehensive and nuanced representation of the compound’s molecular structure.
Architecture
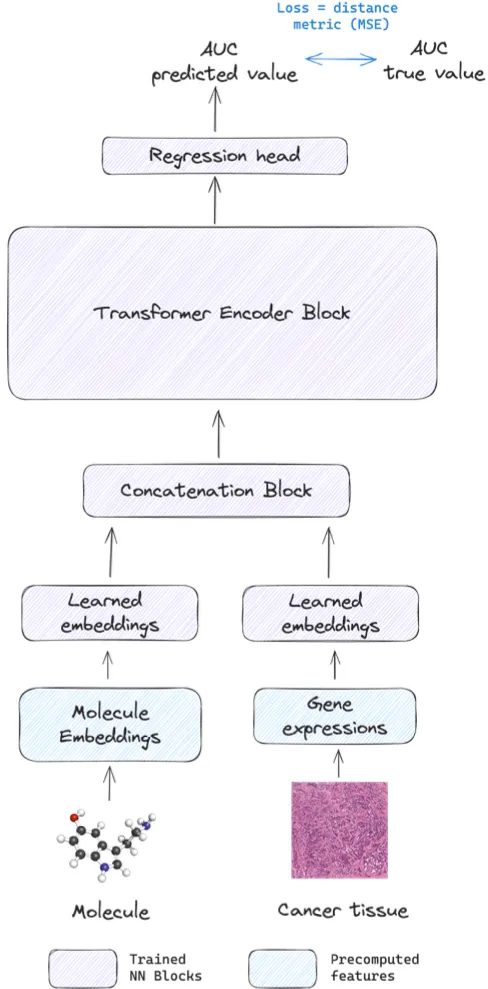
To assess the impact of various drug representations in Drug Response Prediction (DRP), our study incorporated four distinct models. Two models were based on SMILES and SELFIES embeddings, while the other two utilized SMILES tokens and Morgan fingerprints. The tokens were derived from chemBERTa’s Byte Pair Encoding tokenizer. Both latter models were utilized as baseline models for comparative analysis. To ensure a fair evaluation, the models using SMILES, SELFIES, and SMILES tokens were designed with a uniform transformer-based architecture, as depicted in Figure 1. In contrast, the model handling Morgan fingerprints employed a simpler deep Multilayer Perceptron (MLP) network. In all architectures, the LeakyReLU function, with a fixed negative slope of 0.01, was chosen as the activation function.
All models were standardized with a parameter count of 60 million, ensuring both sufficient learning capacity for various representations and maintaining parity in model comparison. Given that DRP is a regression task, each model was trained to predict the Area Under the Curve (AUC) value, utilizing the respective drug representation and gene expressions from cancer cell lines. The training employed the Mean Squared Error (MSE) loss function, widely recognized for its effectiveness in regression tasks.
To enhance the training process and optimize model performance, we employed the Adam optimizer. We integrated advanced regularization techniques to mitigate overfitting and ensure robust model training. Specifically, we employed Stochastic Weight Averaging (SWA) and Early Stopping with a patience of 15 epochs, complemented by a learning rate scheduler that reduces the rate on a plateau with a patience of 10 epochs.
In optimizing the training process, we adopted the Distributed Data Parallel (DDP) strategy along with 16-bits mixed precision to enhance computational efficiency. This was executed on a node equipped with 4 V100 GPUs, allowing for effective parallel processing and resource utilization. All models underwent training under these settings for a maximum of 150 epochs.
Evaluation
Cross-Compound Evaluation
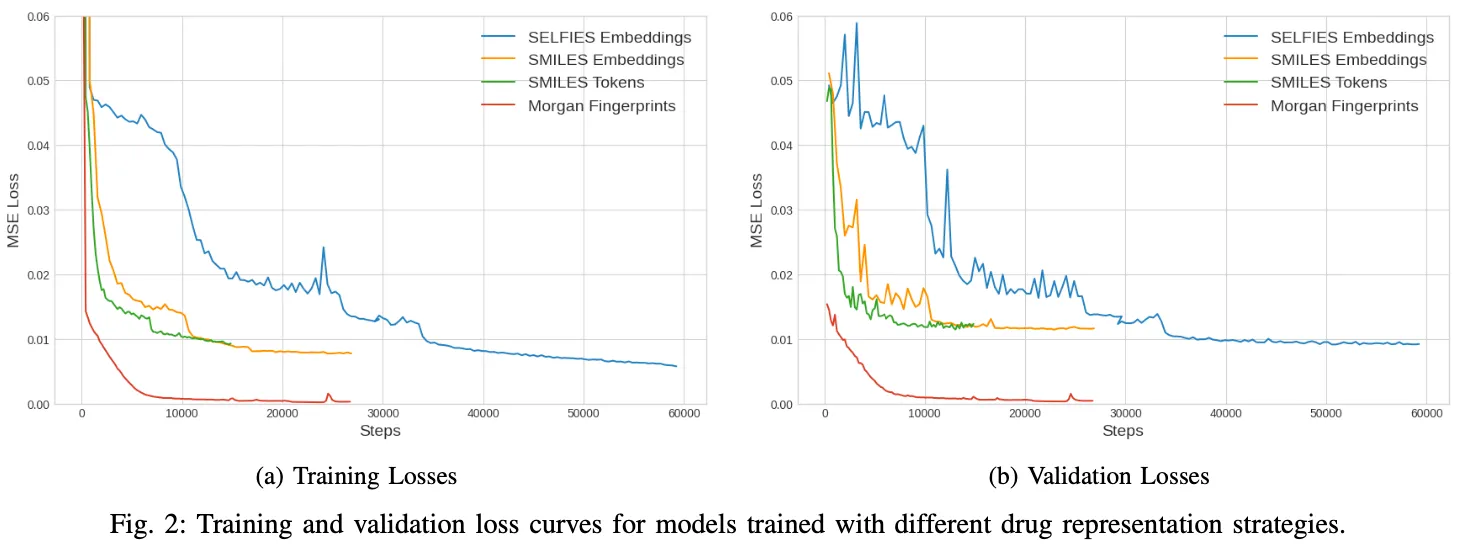
The analysis of the loss curves, presented on Figure 2, reveals a notable variation in the points at which the validation losses of the models converge. Specifically, the models employing SMILES and SELFIES embeddings, along with the one using SMILES tokens, displayed a convergence around a Mean Squared Error (MSE) of approximately 0.01. This uniformity in convergence indicates a similar level of accuracy across these models. However, the Morgan fingerprints model distinguished itself with a significantly lower convergence point, approximately 0.0003. This finding not only highlights its more efficient and accurate predictive capability but also underscores the effectiveness of its underlying algorithmic structure.
Equally important is the observation of the varied training durations among these models. The SELFIES-based model required the longest period, approximately 3.5 hours, to reach a stable validation loss. This extended training time may reflect its complex architecture or the intricacies involved in processing SELFIES embeddings. In contrast, the SMILES Embeddings model completed its training in a considerably shorter span of 1.2 hours, followed closely by the SMILES Tokens model, which achieved stability in its validation loss in just 45 minutes. Remarkably, the Morgan fingerprints model demonstrated exceptional computational efficiency, attaining a stable validation loss in a mere 20 minutes. This swift training process not only signifies the model’s streamlined learning capabilities but also points to potential advantages in terms of time and resource efficiency, which are critical factors in computational drug discovery. Table I presents an array of data, including Mean Squared Error (MSE), Mean Absolute Error (MAE), as well as Pearson and Spearman correlation coefficients.
| MSE | MAE | Pearson Coefficient | Spearman Coefficient | |
|---|---|---|---|---|
| SELFIES Embeddings | 0.053 | 0.1672 | 0.1636 | 0.1635 |
| SMILES Embeddings | 0.050 | 0.1543 | 0.3292 | 0.3091 |
| SMILES Tokens | 0.068 | 0.1833 | 0.2427 | 0.2135 |
| Morgan Fingerprints | 0.045 | 0.1457 | 0.3961 | 0.3975 |
The SELFIES Embeddings model demonstrated a moderate level of accuracy, as indicated by its MSE of 0.053 and MAE of 0.1672. Despite this, the model’s ability to predict in alignment with actual values was notably limited. This is evidenced by its Pearson and Spearman coefficients, the lowest among the models at 0.1636 and 0.1635 respectively, suggesting a relatively weak linear and monotonic relationship between the predictions and true values. On the other hand, the SMILES Embeddings model exhibited a marginally better accuracy profile with an MSE of 0.050 and an MAE of 0.1543, slightly outperforming the SELFIES model. More importantly, its Pearson and Spearman coefficients, recorded at 0.3292 and 0.3091, indicated a moderate level of predictive correlation. This model thus achieved a commendable balance, offering a reasonable degree of accuracy coupled with a satisfactory predictive relationship with the actual values. The SMILES Tokens model, however, presented the highest MSE and MAE figures at 0.068 and 0.1833, signalling a lower accuracy in comparison. While its correlation coefficients were higher than those of the SELFIES model, they did not reach the levels exhibited by the SMILES Embeddings model, with Pearson and Spearman coefficients at 0.2427 and 0.2135, respectively. Contrastingly, the Morgan Fingerprints model stood out as the most accurate and predictive. It not only registered the lowest MSE of 0.045 and an MAE of 0.1457, but also showcased the strongest correlation with the actual data, as reflected by its high Pearson and Spearman coefficients of 0.3961 and 0.3975. This model’s robust performance across all metrics distinctly highlighted its superior predictive accuracy and correlation capabilities.
Essentially, the Morgan fingerprints model emerged as the top performer, excelling in both precision and alignment with true values. The SMILES Tokens model, while less accurate, provided reasonable correlation, and the SMILES Embeddings model balanced moderate accuracy with a fair degree of predictive correlation. The SELFIES embeddings model, despite its longer training duration, showed limitations in its correlation with actual values, emphasizing the necessity of a multifaceted approach in evaluating model efficacy for a comprehensive understanding.
Per-Compound Evaluation
In our analysis, to comprehensively understand the influence of outliers and the inherent variability of Area Under the Curve (AUC) values for each compound, we conducted a per-compound evaluation. This approach is crucial as each compound has been subjected to multiple cell line tests, yielding a spectrum of AUC values. By computing the mean and variance for each compound, we gain a clearer view of the data’s distribution. Figure 4 illustrates this concept effectively; it plots the mean predicted AUC values against the mean actual values for each compound in the training set. The grey lines, both vertical and horizontal, intersecting at each compound’s point, depict the variance in predicted and actual AUC values, offering a visual representation of the data’s spread.
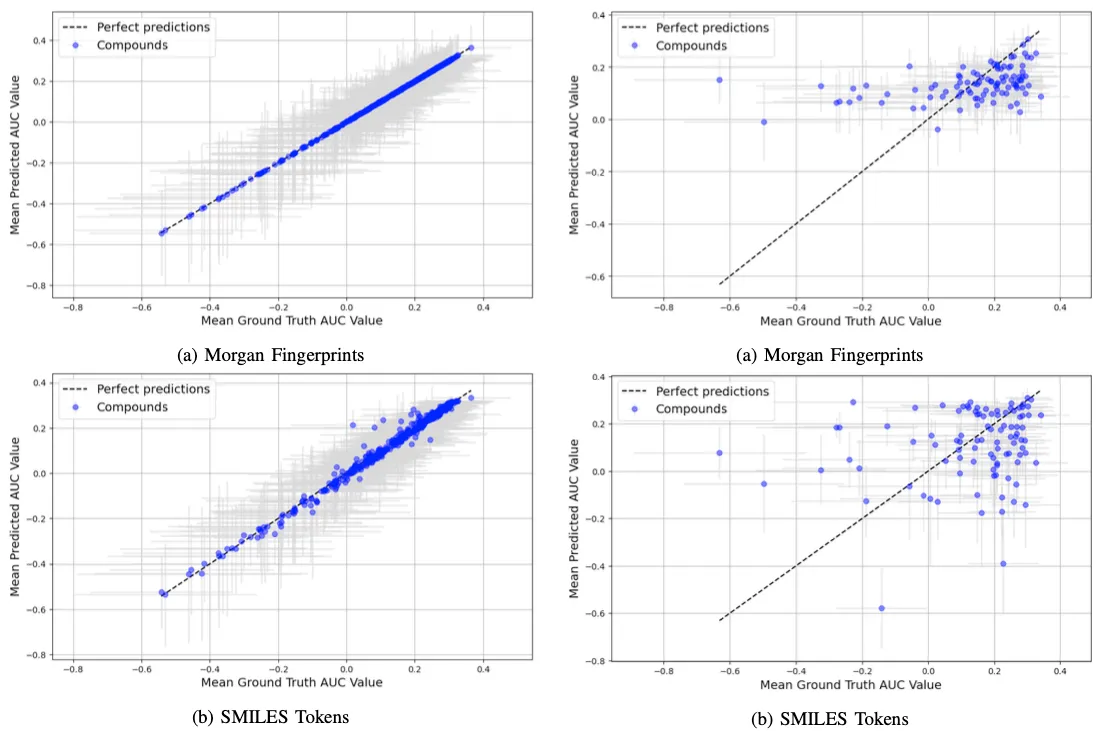

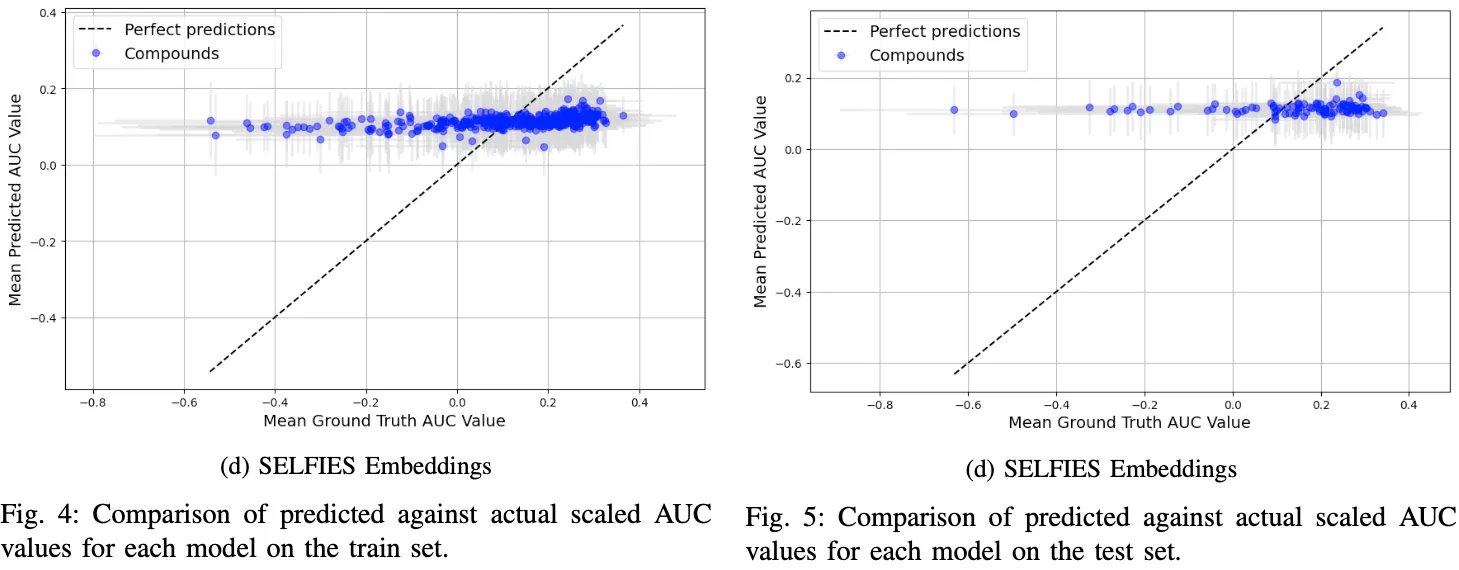
This figure provides critical insights. Notably, it reveals that while the models based on Morgan fingerprints and simple SMILES tokens align closely with the training data, the models based on embeddings, particularly the SELFIES Embeddings model, struggle significantly. The latter model, in fact, appears to output consistently similar values, failing to capture the underlying patterns in the data.
Moving to the evaluation of the test set, as presented in Figure 5 the challenges of generalization to unseen drugs become apparent. Consistent with our cross-compound assessment, no model achieves perfect generalization. The Morgan fingerprints model, though performing relatively better, ex- hibits limitations in capturing trends for negative (scaled) AUC values. This issue is starkly evident in the SELFIES-based model, which reproduces a similar output distribution to that observed in the training set.
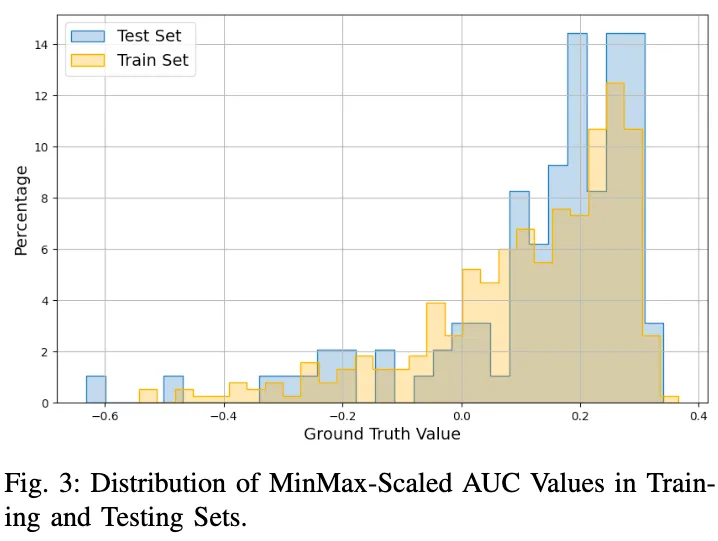
An important observation, highlighted in Figure 3, concerns the distribution of scaled AUC values in the training set. Despite a good overlap in the distribution of values between the training and test sets, there’s a notable underrepresentation of negative values. Specifically, only about 20% of the scaled AUC values range between -0.8 and 0, while the remaining 80% fall between 0 and 0.4. This distribution imbalance suggests that the embedding-based models, particularly the SMILES Embeddings model, have learned to replicate the dominant data distribution, albeit with some adaptability in the case of the SMILES model.
The comparative performance of models based on SMILES embeddings and SMILES tokens merits discussion. Notably, the token-based approach has learned the training set distribution flawlessly, yet the embedding-based counterpart lagged, despite identical architectural frameworks and parameter counts. Moreover, evaluations both cross-compound and per-compound suggest that the embeddings model surpasses the token-based model in performance and robustness. This is evident as the latter displays considerable uncertainty in its predictions across higher AUC values, with outputs scattered around the ideal prediction line. Such dispersion implies that the token-based model may have overfitted the training data significantly. On the other hand, the inability of both models utilizing pre-trained embeddings to fit the training set as effectively as the other models raises questions about the utility of the latent representation in these embeddings, suggesting a potential misalignment with the dataset at hand.
Subsequently, the question arises as to why models with SMILES embeddings markedly outperformed those with SELFIES Embeddings. Given their structural and principled similarities, it would be unexpected to attribute this to an inherent weakness in the SELFIES representation. It seems more plausible to consider the impact of pre-training corpus size. Recall that SELFormer, responsible for SELFIES Embeddings, was pre-trained on a dataset of 2 million SELFIES strings, while chemBERTa, producing the SMILES Embeddings, trained on a 10 million SMILES set. The literature suggests that larger pre-training sets can enhance fine-tuning performance, offering two potential explanations: a larger set may enable the model to develop a more robust and informative latent representation, leading to improved generalization, or the test set in this study might contain compounds present in the extensive SMILES corpus but absent from the smaller SELFIES dataset, which could skew the evaluation in favor of the SMILES-based models.
Finally, a significant variance within the compounds, observed in both the training and test set analyses, points to a high level of noise in the data. This noise likely poses a substantial challenge to the training efficacy of all models, potentially impacting their ability to learn and generalize effectively.
Conclusion
This study aimed to assess the effectiveness of various drug representation methods for Drug Response Prediction in deep learning. We examined a range of models, each employing different techniques like SMILES and SELFIES embeddings, Morgan fingerprints, and SMILES tokens. The findings from this research offer valuable insights and suggest new areas for further investigation.
A key finding from our study is that the SMILES and SELFIES Embeddings based methods, contrary to initial expectations, did not demonstrate superiority over other drug representation techniques. In fact, in scenarios involving drugblind splits, the approach leveraging Morgan fingerprints emerged as a significantly more effective method, outperform- ing its counterparts. This outcome challenges the preconceived notion of the effectiveness of embedding-based models in this context.
More strikingly, the performance of the SELFIES Embeddings method was unexpectedly inferior to the SMILES based model. This result directly contradicts the hypothesis that the SELFIES representation, designed to be more robust than SMILES, would produce more informative embeddings from pre-trained models. The disparity in performance between these two methods highlights the complexity of predicting drug responses and the need for further investigation into the underlying factors that contribute to the effectiveness of these representations. One potential avenue for enhancing model performance might lie in the dimensionality of input embeddings. The current study utilized embeddings that could be inherently noisy, and the models employed were not particularly large. It is plausible that reducing the dimensionality of these embeddings could yield different, potentially more favorable results. This hypothesis warrants further investigation, as it could lead to significant improvements in model performance.
Another approach to augment model efficacy could involve preprocessing the less frequently represented AUC values. Given the observed distribution imbalance in the data, specifically targeting and adjusting these underrepresented values might lead to more accurate and generalized predictions.
Lastly, considering the diversity of predictions obtained from all models, there is a compelling case for exploring an ensemble method. By harnessing the strengths of each individual model, an ensemble approach could potentially outperform the individual models. This strategy, blending multiple predictive models, holds the promise of achieving a more robust and accurate drug response prediction system.
In summary, this research highlights the strengths and weaknesses of different drug representation methods. It also suggests potential areas for future work, such as reducing the dimensionality of input embeddings, refining preprocessing methods for less common AUC values, and exploring the potential of ensemble methods. These directions could lead to improvements in the accuracy and effectiveness of drug response predictions, an important goal in the ongoing development of medical treatments and patient care.